API
Import scirpy together with scanpy as
import scanpy as sc
import scirpy as ir
For consistency, the scirpy API tries to follow the scanpy API as closely as possible.
Input/Output: io
Note
scirpy’s data structure has been updated in v0.13.0.
Previously, receptor data was expanded into columns of
adata.obs, now they are stored as an awkward array inadata.obsm["airr"]. Moreover, we now useMuDatato handle paired transcriptomics and AIRR data.
AnnDataobjects created with older versions of scirpy can be upgraded withscirpy.io.upgrade_schema()to be compatible with the latest version of scirpy.Please check out
the release notes for details about the changes and
the documentation about Scirpy’s data structure
|
Update older versions of a scirpy anndata object to the latest schema. |
The following functions allow to import V(D)J information from various formats.
|
Read MuData object from HDF5 file |
|
Read |
|
Read AIRR data from 10x Genomics cell-ranger output. |
|
Read data from TraCeR ([SLonnbergP+16]). |
|
|
|
Read IR data from the BD Rhapsody Analysis Pipeline. |
|
Read data from AIRR rearrangement format. |
|
Scirpy can export data to the following formats:
|
|
|
To convert own formats into the scirpy Storing AIRR rearrangement data in AnnData, we recommend building
a list of AirrCell objects first, and then converting them into
an AnnData object using from_airr_cells().
For more details, check the Data loading tutorial.
|
Data structure for a Cell with immune receptors. |
|
|
|
Convert an adata object with IR information back to a list of |
Preprocessing: pp
|
Selects primary/secondary VJ/VDJ cells per chain according to the Immune receptor (IR) model. |
|
Merge two AnnData objects with IR information (e.g. |
|
Computes a sequence-distance metric between all unique VJ CDR3 sequences and between all unique VDJ CDR3 sequences. |
Get: get
The get module allows retrieving AIRR data stored in adata.obsm["airr"] as a per-cell DataFrame
or Series.
|
Retrieve AIRR variables for each cell, given a specific chain. |
|
Contextmanager that temporarily adds columns to obs. |
|
Contextmanager that temporarily adds AIRR information to obs. |
Tools: tl
Tools add an interpretable annotation to the AnnData object
which usually can be visualized by a corresponding plotting function.
Generic
|
Summarizes the number/fraction of cells of a certain category by a certain group. |
Quality control
|
Perform quality control based on the receptor-chain pairing configuration. |
Define and visualize clonotypes
|
Define clonotypes based on CDR3 nucleic acid sequence identity. |
|
Define clonotype clusters. |
|
Finds evidence for Convergent evolution of clonotypes. |
|
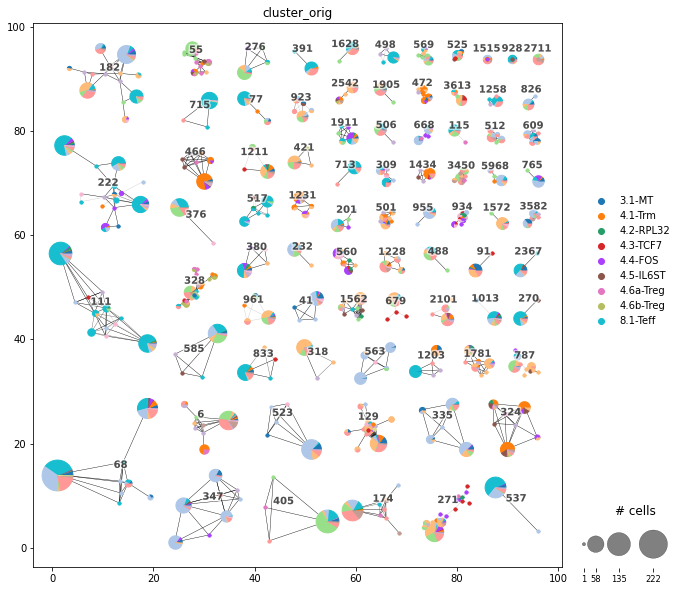
Computes the layout of the clonotype network. |
|
Get an |
Analyse clonal diversity
|
Adds a column to |
|
Summarizes clonal expansion by a grouping variable. |
|
Computes the alpha diversity of clonotypes within a group. |
|
Compute distance between cell groups based on clonotype overlap. |
|
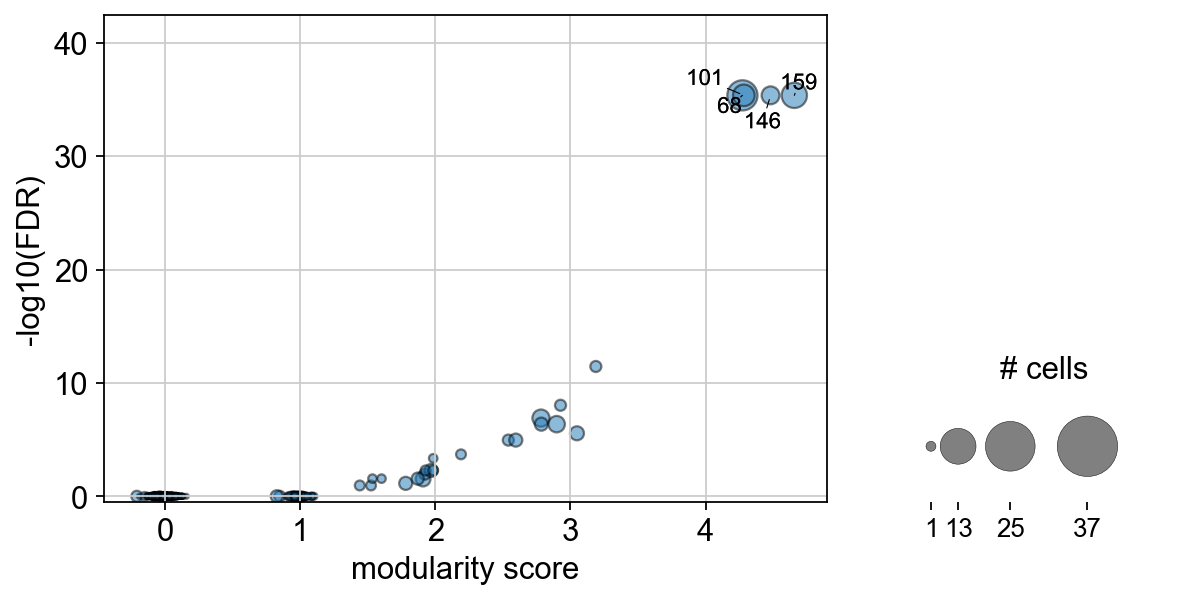
Identifies clonotypes or clonotype clusters consisting of cells that are more transcriptionally related than expected by chance by computing the Clonotype modularity. |
|
Aims to find clonotypes that are the most enriched or depleted in a category. |
Query reference databases
|
Query a referece database for matching immune cell receptors. |
|
Annotate cells based on the result of |
|
Returns the inner join of |
V(D)J gene usage
|
Summarizes the distribution of CDR3 region lengths. |
Plotting: pl
Generic
|
A customized wrapper to the |
Tools
Every of these plotting functions has a corresponding tool in the scirpy.tl
section. Depending on the computational load, tools are either invoked on-the-fly
when calling the plotting function or need to be precomputed and stored in
AnnData previously.
|
Plot the alpha diversity per group. |
|
Visualize clonal expansion. |
|
Plots the number of cells per group, split up by a categorical variable. |
|
Show the distribution of CDR3 region lengths. |
|
Creates a ribbon plot of the most abundant VDJ combinations. |
|
Visualizes overlap betwen a pair of samples on a scatter plot or |
|
Plots the Clonotype modularity score against the associated log10 p-value. |
|
Plot the Clonotype network. |
|
Aims to find clonotypes that are the most enriched or depleted in a category. |


Base plotting functions: pl.base
|
Basic plotting function built on top of bar plot in Pandas. |
|
Basic plotting function built on top of line plot in Pandas. |
|
Basic plotting function built on top of bar plot in Pandas. |
|
Basic plotting function for drawing KDE-smoothed curves. |
Plot styling: pl.styling
|
Apply a predefined style to an axis object. |
|
Style an axes object. |
Datasets: datasets
Example datasets
Return the dataset from [WMdA+20] as MuData object. |
|
Return the dataset from [WMdA+20] as AnnData object, downsampled to 3000 TCR-containing cells. |
|
Return the dataset from [MMR+20] as AnnData object. |
Reference databases
|
Download VDJdb and process it into an AnnData object. |
|
Download IEBD v3 and process it into an AnnData object. |
A reference database is also just a Scirpy-formatted AnnData object. This means you can follow the instructions in the data loading tutorial to build a custom reference database.
Utility functions: util
|
Transparent access to airr modality in both AnnData and MuData objects. |
|
Compute a graph layout by layouting all connected components individually. |
|
Compute the Fruchterman-Reingold layout respecting node sizes. |
|
Get an igraph object from an adjacency or distance matrix. |
IR distance utilities: ir_dist
|
Calculate a sequence x sequence distance matrix. |
distance metrics
Abstract base class for a CDR3-sequence distance calculator. |
|
Abstract base class for a DistanceCalculator that computes distances in parallel. |
|
Calculates the Identity-distance between CDR3 sequences. |
|
Calculates the Levenshtein edit-distance between sequences. |
|
Calculates the Hamming distance between sequences of identical length. |
|
Calculates distance between sequences based on pairwise sequence alignment. |