scirpy.pl.clonotype_modularity
- scirpy.pl.clonotype_modularity(adata, ax=None, target_col='clonotype_modularity', jitter=0.01, panel_size=(6, 4), base_size=2, size_power=1, show_labels=True, labels_quantile_cutoff=(0.9, 0.9), labels=None, label_fontsize=10, label_fontweight=300, label_fontoutline=0, label_adjusttext=True, show_size_legend=True, legend_width=2, fig_kws=None, airr_mod='airr')
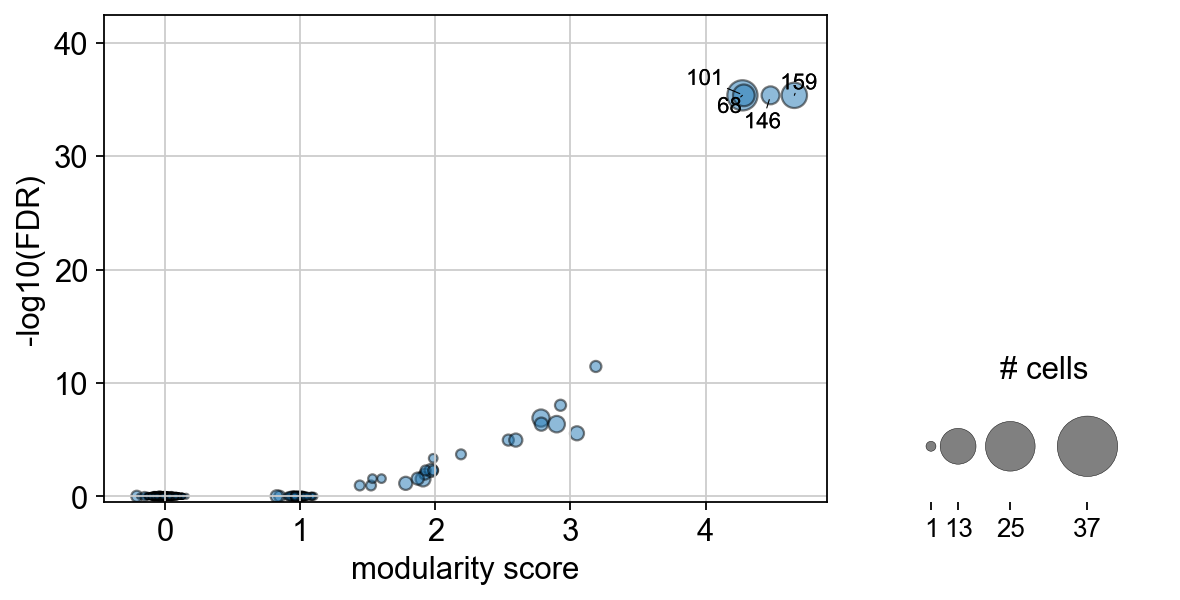
Plots the Clonotype modularity score against the associated log10 p-value.
`
Plots the Clonotype modularity score against the associated log10 p-value.
- Parameters
- adata :
AnnData|MuData|DataHandlerUnion[AnnData,MuData,DataHandler] AnnData or MuData object that contains AIRR information.
- ax
Add the plot to a predefined Axes object.
- target_col
Column in
adata.obscontaining the clonotype modularity score and key inadata.unscontaining the dictionary with parameters. Will look for p-values or FDRs inadata.obs["{target_col}_pvalue"]oradata.obs["{target_col}_fdr"].- jitter :
float(default:0.01) Add random jitter along the x axis to avoid overlapping point. Samples from
N(0, jitter * (max(arr) - min(arr)))- base_size :
float(default:2) Size of a point representing 1 cell.
- size_power :
float|NoneOptional[float] (default:1) Point sizes are raised to the power of this value.
- show_labels :
bool(default:True) Whether to show text labels for the clonotypes with highest clonotype modularity.
- labels_quantile_cutoff :
Tuple[float,float] (default:(0.9, 0.9)) Label clonotypes with exceeding the given quantile cutoff. Only unique values are considered for calculating the quantiles (avoiding thousands of singleton clonotypes with modularity 0). The cutoff is specified as a tuple
(cutoff_for_modularity, cutoff_for_pvalue).- labels :
Sequence[str] |NoneOptional[Sequence[str]] (default:None) Explicitly pass a list of clonotypes to label. Overrides
labels_quantile_cutoff.- label_fontsize :
int|NoneOptional[int] (default:10) Fontsize for the clonotype labels
- label_fontweight :
str|floatUnion[str,float] (default:300) Fontweight for the clonotype labels
- label_fontoutline :
int(default:0) Size of the fontoutline added to the clonotype labels. Set to
Noneto disable.- label_adjusttext :
bool(default:True) Whether to “repel” labels such that they don’t overlap using the
adjustTextlibrary. This option significantly increases the runtime.- show_size_legend :
bool(default:True) Whether to show a legend for dot sizes on the right margin
- legend_width :
float(default:2) Width of the legend column in inches. Only applies if
show_size_legendis True- fig_kws :
dict|NoneOptional[dict] (default:None) Parameters passed to the
matplotlib.pyplot.figure()call if noaxis specified.- airr_mod :
str(default:'airr') Name of the modality with AIRR information is stored in the
MuDataobject. if anAnnDataobject is passed to the function, this parameter is ignored.
- adata :
- Returns
A list of axis objects