API
Import scirpy together with scanpy as
import scanpy as sc
import scirpy as ir
For consistency, the scirpy API tries to follow the scanpy API as closely as possible.
Input/Output: io
The following functions allow to import V(D)J information from various formats.
|
Read |
|
Read IR data from 10x Genomics cell-ranger output. |
|
Read data from TraCeR ([SLonnbergP+16]). |
|
|
|
Read AIRR-compliant data. |
To convert own formats into the scirpy Data structure, we recommend building
a list of IrCell objects first, and then converting them into
an AnnData object using from_ir_objs().
For more details, check the Data loading tutorial.
|
Data structure for a Cell with immune receptors. |
|
Data structure for an immune cell receptor chain. |
|
|
|
Convert an adata object with IR information back to a list of IrCells. |
Preprocessing: pp
|
Merge adaptive immune receptor (IR) data with transcriptomics data into a single |
|
Construct a neighborhood graph based on CDR3 sequence similarity. |
Tools: tl
Tools add an interpretable annotation to the AnnData object
which usually can be visualized by a corresponding plotting function.
Generic
|
Summarizes the number/fraction of cells of a certain category by a certain group. |
Quality control
|
Perform quality control based on the receptor-chain pairing configuration. |
Define and visualize clonotypes
|
Define clonotypes based on CDR3 nucleic acid sequence identity. |
|
Define clonotype clusters based on CDR3 distance. |
|
Finds evidence for Convergent evolution of clonotypes. |
|
Layouts the clonotype network for plotting. |
|
Get an |
Analyse clonal diversity
|
Adds a column to |
|
Summarizes clonal expansion by a grouping variable. |
|
Computes the alpha diversity of clonotypes within a group. |
|
Compute distance between cell groups based on clonotype overlap. |
|
Aims to find clonotypes that are the most enriched or depleted in a category. |
V(D)J gene usage
|
Summarizes the distribution of CDR3 region lengths. |
Plotting: pl
Generic
|
A customized wrapper to the |
Tools
Every of these plotting functions has a corresponding tool in the scirpy.tl
section. Depending on the computational load, tools are either invoked on-the-fly
when calling the plotting function or need to be precomputed and stored in
AnnData previously.
|
Plot the alpha diversity per group. |
|
Visualize clonal expansion. |
|
Plots the number of cells per group, split up by a categorical variable. |
|
Show the distribution of CDR3 region lengths. |
|
Creates a ribbon plot of the most abundant VDJ combinations. |
|
Visualizes overlap betwen a pair of samples on a scatter plot or |
|
Aims to find clonotypes that are the most enriched or depleted in a category. |
|
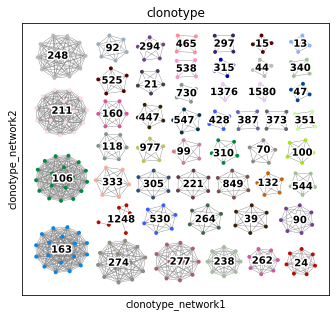
Plot the Clonotype network. |


Base plotting functions: pl.base
|
Basic plotting function built on top of bar plot in Pandas. |
|
Basic plotting function built on top of line plot in Pandas. |
|
Basic plotting function built on top of bar plot in Pandas. |
|
Basic plotting function for drawing KDE-smoothed curves. |
Plot styling: pl.styling
|
Apply a predefined style to an axis object. |
|
Style an axes object. |
Datasets: datasets
|
Return the dataset from [WMdA+20] as AnnData object. |
Return the dataset from [WMdA+20] as AnnData object, downsampled to 3000 TCR-containing cells. |
|
Return the dataset from [MMR+20] as AnnData object. |
Utility functions: util
|
Compute a graph layout by layouting all connected components individually. |
IR distance metrics: ir_dist
|
Calculate a sequence x sequence distance matrix. |
|
Abstract base class for a CDR3-sequence distance calculator. |
|
Abstract base class for a DistanceCalculator that computes distances in parallel. |
|
Calculates the Identity-distance between CDR3 sequences. |
|
Calculates the Levenshtein edit-distance between sequences. |
|
Calculates the Hamming distance between sequences of identical length. |
|
Calculates distance between sequences based on pairwise sequence alignment. |