scirpy.pl.clonotype_network
-
scirpy.pl.clonotype_network(adata, *, color=None, panel_size=(10, 10), legend_loc=None, palette=None, basis='clonotype_network', edges_color=None, edges_cmap=<matplotlib.colors.LinearSegmentedColormap object>, edges=None, edges_width=0.4, size=None, **kwargs)¶ Plot the Clonotype network.
`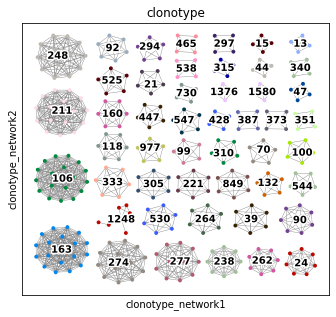
Plot the Clonotype network.
Requires running
scirpy.tl.clonotype_network()before, to compute the layout.- Parameters
- adata :
AnnDataAnnData Annotated data matrix.
- color :
str,Collection[str],NoneUnion[str,Collection[str],None] (default:None) Keys for annotations of observations/cells or variables/genes, e.g.,
'ann1'or['ann1', 'ann2'].- panel_size :
Tuple[float,float]Tuple[float,float] (default:(10, 10)) Size tuple (
width,height) of a single panel in inches.- legend_loc :
str,NoneOptional[str] (default:None) Location of legend, either
'on data','right margin'or a valid keyword for thelocparameter ofLegend. When set toNoneautomatically determines the legend position based on the following criteria: (1)'on data'when coloring byclonotype, (2)'right margin'if the number of categories < 50, and (3) and'none'otherwise.- palette :
str,Sequence[str],Cycler,NoneUnion[str,Sequence[str],Cycler,None] (default:None) Colors to use for plotting categorical annotation groups. The palette can be a valid
ListedColormapname ('Set2','tab20', …) or aCyclerobject. It is possible to specify a list of the same size ascolorto choose a different color map for each panel.- basis :
strstr(default:'clonotype_network') Key under which the graph layout coordinates are stored in
adata.obsm- edges_color :
str,NoneOptional[str] (default:None) Color of the edges. Set to
Noneto color by connectivity and use the color map provided byedges_cmap.- edges_cmap :
Colormap,strUnion[Colormap,str] (default:<matplotlib.colors.LinearSegmentedColormap object at 0x7f0b738df410>) Colors to use for coloring edges by connectivity
- edges :
bool,NoneOptional[bool] (default:None) Whether to show the edges or not. Defaults to True for < 1000 displayed cells, to False otherwise.
- edges_width :
floatfloat(default:0.4) width of the edges
- size :
float,Sequence[float],NoneUnion[float,Sequence[float],None] (default:None) Point size. If
Noneit is automatically computed as 24000 /n_cells. Can be a sequence containing the size for each cell. The order should be the same as in adata.obs. Other than in the defaultscanpyimplementation this respects that some cells might not be shown in the plot.- **kwargs
Additional arguments which are passed to
scirpy.pl.embedding().
- adata :
- Return type
- Returns
A list of axes objects, containing one element for each
color, or None ifshow == True.
See also