Examples#
Examples from real datasets you’d actually analyse.
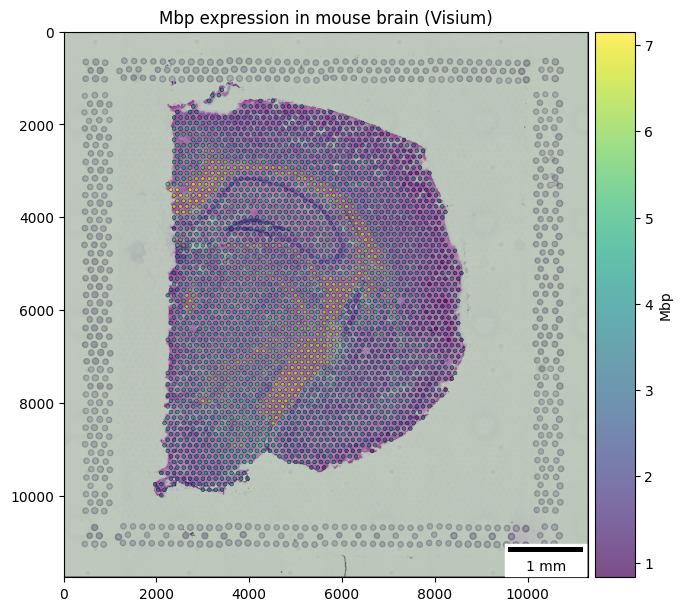
Visium mouse brain
Render H&E tissue, overlay spots, color by gene expression and by cluster, and finish with a publication-style figure.
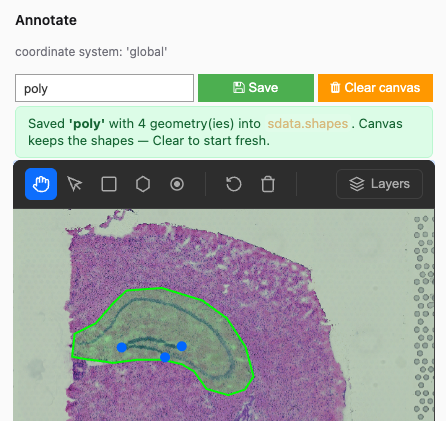
Interactive region annotation
Draw regions of interest directly on a spatialdata-plot canvas with
sdata.pl.annotate(...) and persist them as a ShapesModel element.
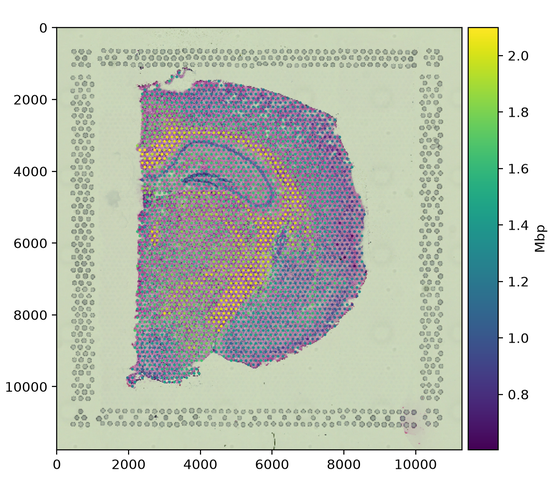
Colouring by expression
Point render_* at exactly the values you want: choose the table
(table_name), the matrix (table_layer, e.g. raw vs log-normalised), and
look genes up by symbol (gene_symbols).