Tutorials#
Entry-point material for learning the API on synthetic data.
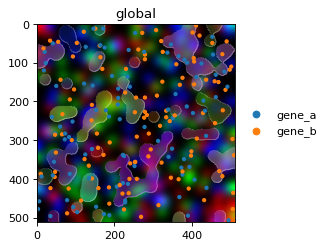
The fluent .pl API, layering, and styling on the in-memory blobs
dataset. Ideal first read.
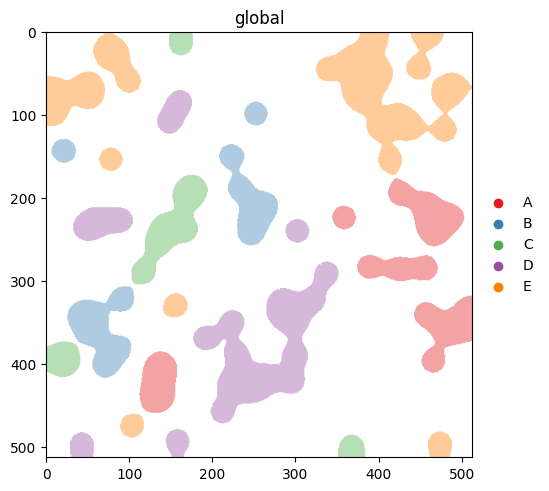
How color= resolves, the v0.3.0 groups behaviour, and building
perceptually well-spaced or colourblind-safe palettes with
make_palette and make_palette_from_data.
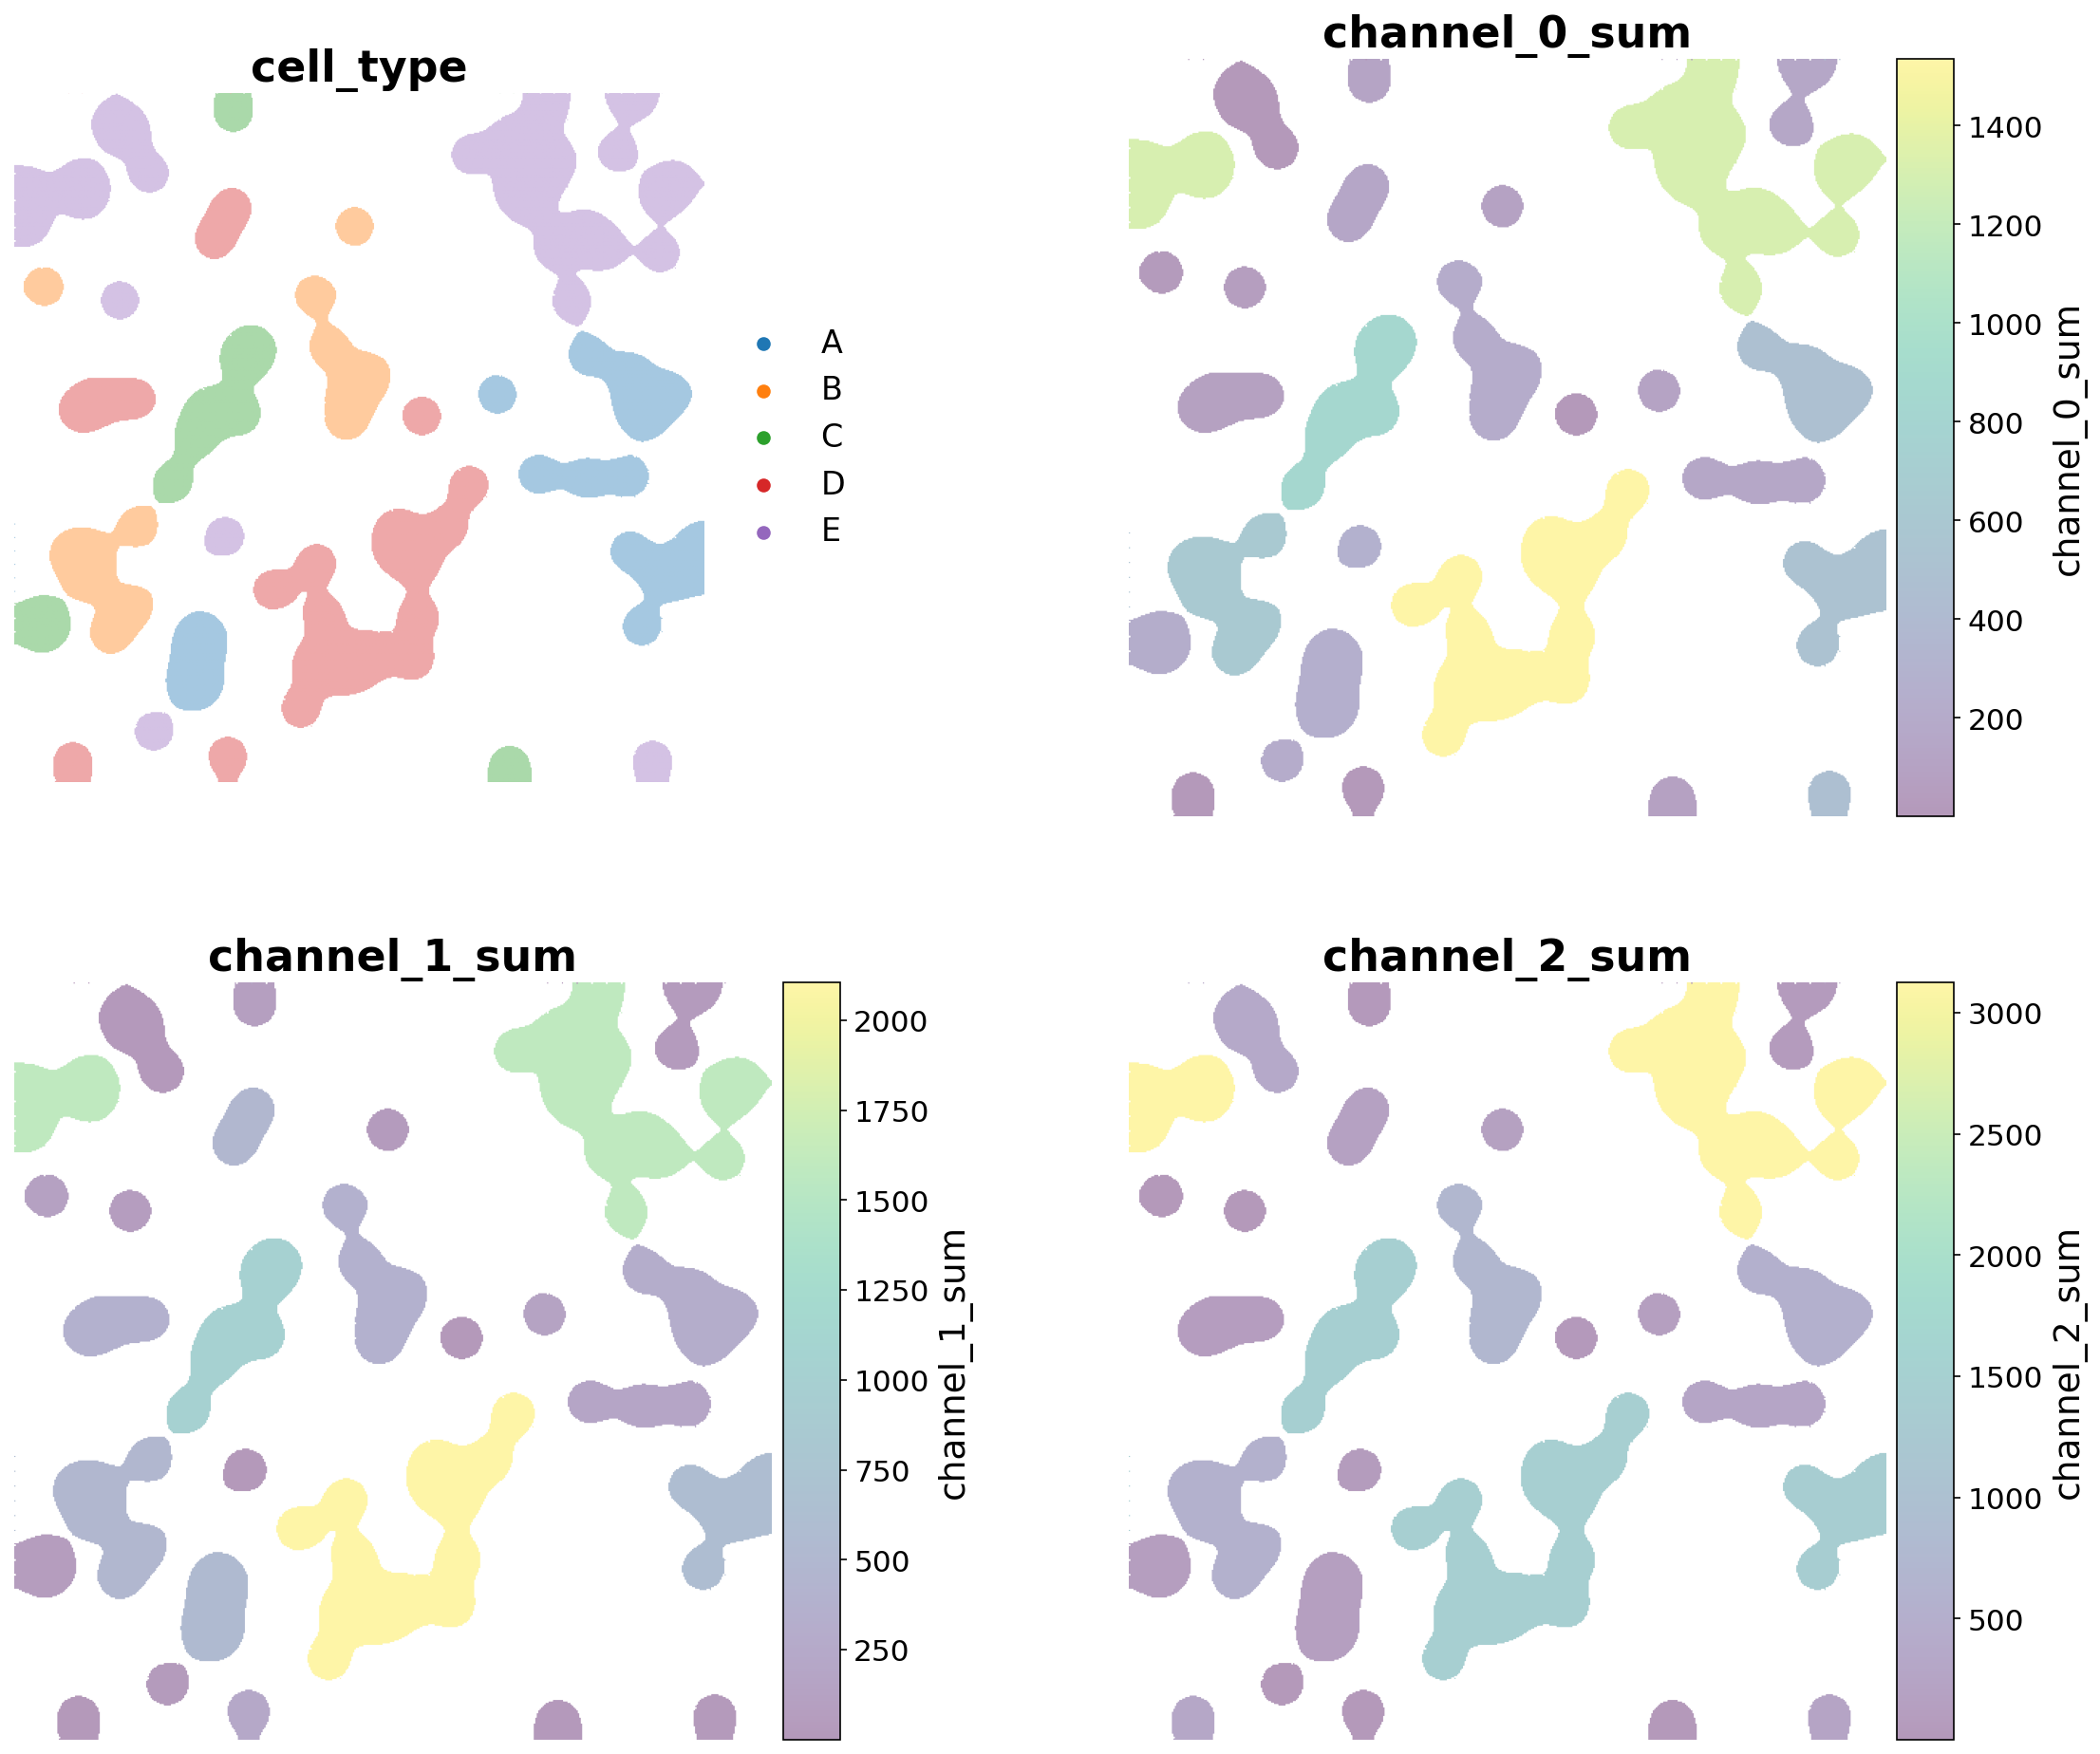
Render several colourings at once by passing a list to color=,
scanpy-style, with per-panel legends/colourbars, shared palette/cmap,
and ncols grid control.
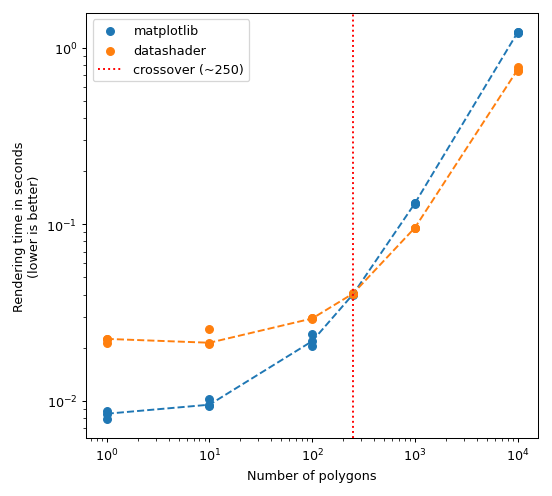
Keep rendering fast on large data: automatic rasterization and scale
selection for images, and the datashader backend for large collections
of shapes and points.
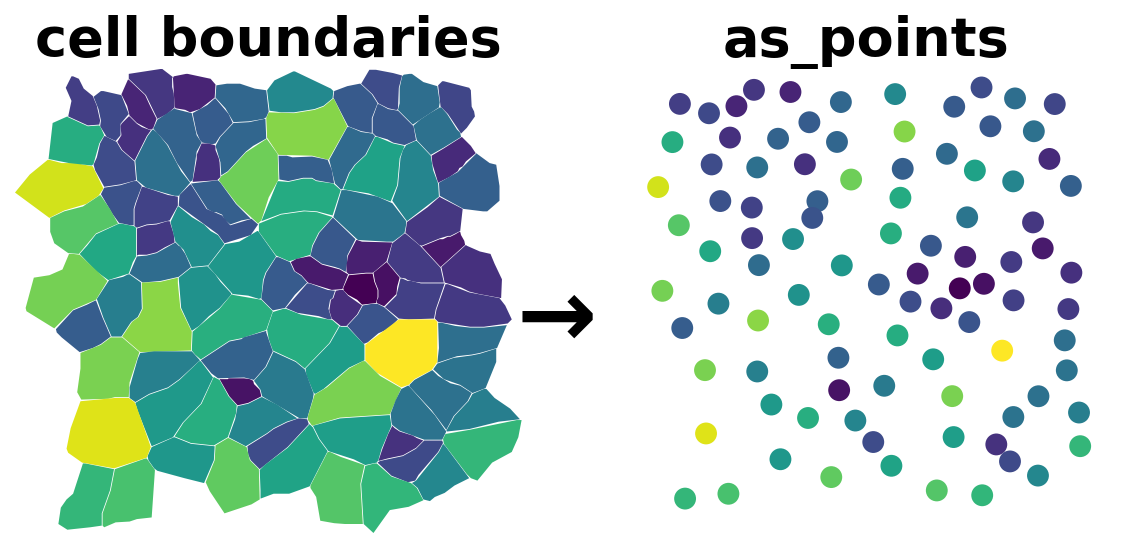
Draw shapes and label masks as one dot per centroid with as_points=True
— a fast overview that trades geometry for speed, including the matplotlib
→ datashader switch above ~50k elements.
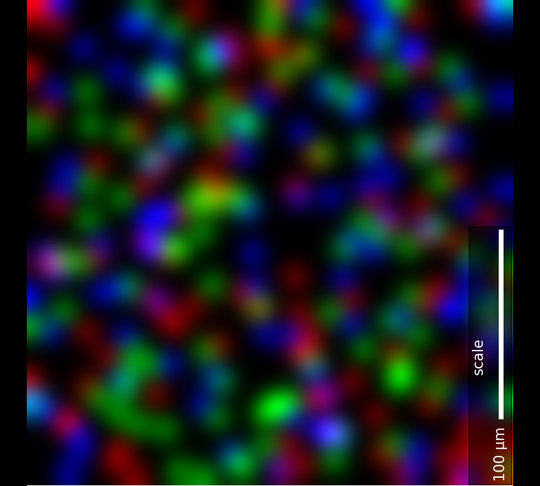
Add a physical scalebar with scalebar_dx, choose units, and style
placement, colour, length and fonts through scalebar_params.