scirpy.pl.clonotype_network
- scirpy.pl.clonotype_network(adata, *, color=None, basis='clonotype_network', panel_size=(10, 10), color_by_n_cells=False, scale_by_n_cells=True, base_size=None, size_power=None, use_raw=None, show_labels=True, label_fontsize=None, label_fontweight='bold', label_fontoutline=3, label_alpha=0.6, label_y_offset=2, legend_fontsize=None, legend_width=2, show_legend=None, show_size_legend=True, palette=None, cmap=None, edges_color=None, edges_cmap=<matplotlib.colors.LinearSegmentedColormap object>, edges=True, edges_width=0.4, frameon=None, title=None, ax=None, fig_kws=None)
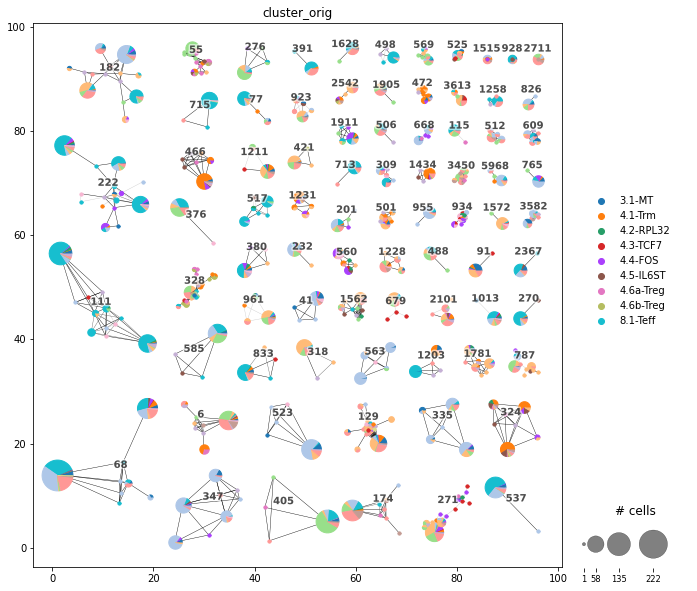
Plot the Clonotype network.
`
Plot the Clonotype network.
Requires running
scirpy.tl.clonotype_network()first, to compute the layout.The clonotype network usually consists of many disconnected components, each of them representing a clonotype. Each node represents cells with an identical receptor configuration (i.e. identical CDR3 sequences, and identical v genes if
same_v_genewas specified during clonotype definition). The size of each dot refers to the number of cells with the same receptor configurations.For more details on the clonotype definition, see
scirpy.tl.define_clonotype_clusters()and the respective section in the tutorial.When the network is colored by continuous variables (genes, or numeric columns from
obs), the average of the cells in each dot is computed. When the network is colored by categorical variables (categorical columns fromobs), different categories per dot are visualized as pie chart.The layouting algorithm of
scirpy.tl.clonotype_network()takes point sizes into account. For this reason, we recommend providingbase_sizeandsize_poweralready to the tool function.- Parameters
- adata :
AnnData Annotated data matrix.
- color :
Sequence[str] |str|NoneUnion[Sequence[str],str,None] (default:None) Keys for annotations of observations/cells or variables/genes, e.g.
patientorCD8A.- basis :
str(default:'clonotype_network') Key under which the graph layout coordinates are stored in
adata.obsm.- panel_size :
Tuple[float,float] (default:(10, 10)) Size of the main figure panel in inches.
- color_by_n_cells :
bool(default:False) Color the nodes by the number of cells they represent. This overrides the
coloroption.- scale_by_n_cells :
bool(default:True) Scale the nodes by the number of cells they represent. If this is set to
True, we recommend using a “size-aware” layout inscirpy.tl.clonotype_network()to avoid overlapping nodes (default).- base_size :
float|NoneOptional[float] (default:None) Size of a point representing 1 cell. Per default, the value provided to
scirpy.tl.clonotype_network()is used. This option allows to override this value without recomputing the layout.- size_power :
float|NoneOptional[float] (default:None) Point sizes are raised to the power of this value. Per default, the value provided to
scirpy.tl.clonotype_network()is used. This option allows to override this value without recomputing the layout.- use_raw :
bool|NoneOptional[bool] (default:None) Use
adata.rawfor plotting gene expression values. Default: Useadata.rawif it exists, andadataotherwise.- show_labels :
bool(default:True) If
Trueplot clonotype ids on top of the subnetworks.- label_fontsize :
int|NoneOptional[int] (default:None) Fontsize for the clonotype labels
- label_fontweight :
str(default:'bold') Fontweight for the clonotype labels
- label_fontoutline :
int(default:3) Size of the fontoutline added to the clonotype labels. Set to
Noneto disable.- label_alpha :
float(default:0.6) Transparency of the clonotype labels
- label_y_offset :
float(default:2) Offset the clonotype label on the y axis for better visibility of the subnetworks.
- legend_fontsize
Font-size for the legend.
- show_legend :
bool|NoneOptional[bool] (default:None) Whether to show a legend (when plotting categorical variables) or a colorbar (when plotting continuous variables) on the right margin. Per default, a legend is shown if the number of categories is smaller than 50, other wise no legend is shown.
- show_legend_size
Whether to show a legend for dot sizes on the right margin. This option is only applicable if
scale_by_n_cellsisTrue.- palette :
str|Sequence[str] |Cycler|NoneUnion[str,Sequence[str],Cycler,None] (default:None) Colors to use for plotting categorical annotation groups. The palette can be a valid
ListedColormapname ('Set2','tab20', …) or aCyclerobject. a different color map for each panel.- cmap :
str|Colormap|NoneUnion[str,Colormap,None] (default:None) Colormap to use for plotting continuous variables.
- edges_color :
str|NoneOptional[str] (default:None) Color of the edges. Set to
Noneto color by connectivity and use the color map provided byedges_cmap.- edges_cmap :
Colormap|strUnion[Colormap,str] (default:<matplotlib.colors.LinearSegmentedColormap object at 0x134623fd0>) Colormap to use for coloring edges by connectivity.
- edges :
bool(default:True) Whether to show the edges or not.
- edges_width :
float(default:0.4) width of the edges
- frameon :
bool|NoneOptional[bool] (default:None) Whether to show a frame around the plot
- title :
str|NoneOptional[str] (default:None) The main plot title
- ax :
Axes|NoneOptional[Axes] (default:None) Add the plot to a predefined Axes object.
- cax
Add the colorbar (if any) to this predefined Axes object.
- fig_kws :
dict|NoneOptional[dict] (default:None) Parameters passed to the
matplotlib.pyplot.figure()call if noaxis specified.
- adata :
- Return type
- Returns
A list of axes objects, containing one element for each
color, or None ifshow == True.