scverse × Biomni: Agentic Single-Cell Analysis

Single-cell and spatial omics have unlocked unprecedented insights into cellular diversity, tissue architecture, and drug responses. Despite the remarkable progress in computational tools, the diversity and complexity of analyses can still pose challenges. While the scverse ecosystem provides powerful and interoperable tools such as Scanpy, scvi-tools, Squidpy, AnnData, MuData, and SpatialData, researchers can sometimes face a steep learning curve, particularly when integrating multiple analytical steps or modalities.
scverse is a community-driven, open-source initiative behind many of the most widely adopted Python tools in single-cell biology, known for promoting modular, interoperable, and scalable analysis across diverse modalities—from transcriptomics to spatial and immune profiling.
We’re excited to announce a collaboration between scverse and Biomni to further streamline and enhance single-cell and spatial omics analyses. Biomnis intelligent agentic interface is now capable of using scverse tools, enabling researchers to seamlessly integrate, execute, and manage analyses across ten core scverse packages through natural language prompts. Researchers can describe their analysis goals in plain English - e.g., “cluster cells and identify markers” or “analyze perturbation effects between treatment groups” - and Biomni automatically generates and runs the corresponding scanpy, pertpy, squidpy, or scvi-tools code.
The agent understands biological context, handles parameters and dependencies, and returns reproducible results - no coding required. Notably, all codes written by agents are documented and available to users for reproduction or modification as a Jupyter notebook. This is an early-stage capability, and manual review of outputs is encouraged to ensure accuracy, and we invite constructive community feedback to improve.
Conduct Single-cell Analyses with Natural Language
To illustrate, here are a few examples of how Biomni equipped with scverse packages can enable efficient analysis:
“Annotate cell types in this adata.h5ad, run Leiden clustering, and show a UMAP colored by CD3 and CD19 expression.”
→ Biomni invokes Scanpy for preprocessing, clustering, annotation, and visualization.
“Perform compositional analysis with scCODA in this perturb-seq dataset.”
→ Biomni uses Pertpy to perform scCODA compositional analysis.
“Detect spatially variable genes in this Visium dataset and overlay results on the H&E image.”
→ Biomni leverages Squidpy and SpatialData for spatial feature detection and plotting.
Orchestrate Multi-Step Complex Single-Cell Workflows
Moving beyond the agentic delegation of individual single-cell tasks, Biomni also enables scientists to run multi-step, cross-tool workflows using natural language. Instead of writing and debugging code across several libraries, you can now execute complex pipelines with a single prompt.
Input: A Visium spatial transcriptomics dataset in .h5ad format, aligned with histology images and metadata (e.g., treatment condition).
Example prompt:
“Run a complete single‑cell + spatial workflow on the attached Visium .h5ad using the scverse stack—scanpy for QC/normalization, scvi‑tools for integration and clustering, celltypist for label transfer, scvelo for RNA‑velocity trajectories, squidpy for spatial interactions. Contrast treatment conditions, highlight driver pathways, and return key plots plus a brief HTML report.”
Plans composed by Biomni:
- [✓] Load and explore the Visium .h5ad data
- [✓] Scanpy QC and normalization (completed)
- [✓] scvi-tools integration and clustering (completed)
- [✓] celltypist label transfer (completed)
- [✓] scVelo RNA velocity trajectories (completed)
- [✓] Squidpy spatial interactions (completed)
- [✓] Driver pathway identification (completed)
- [✓] Generate comprehensive HTML report (completed)
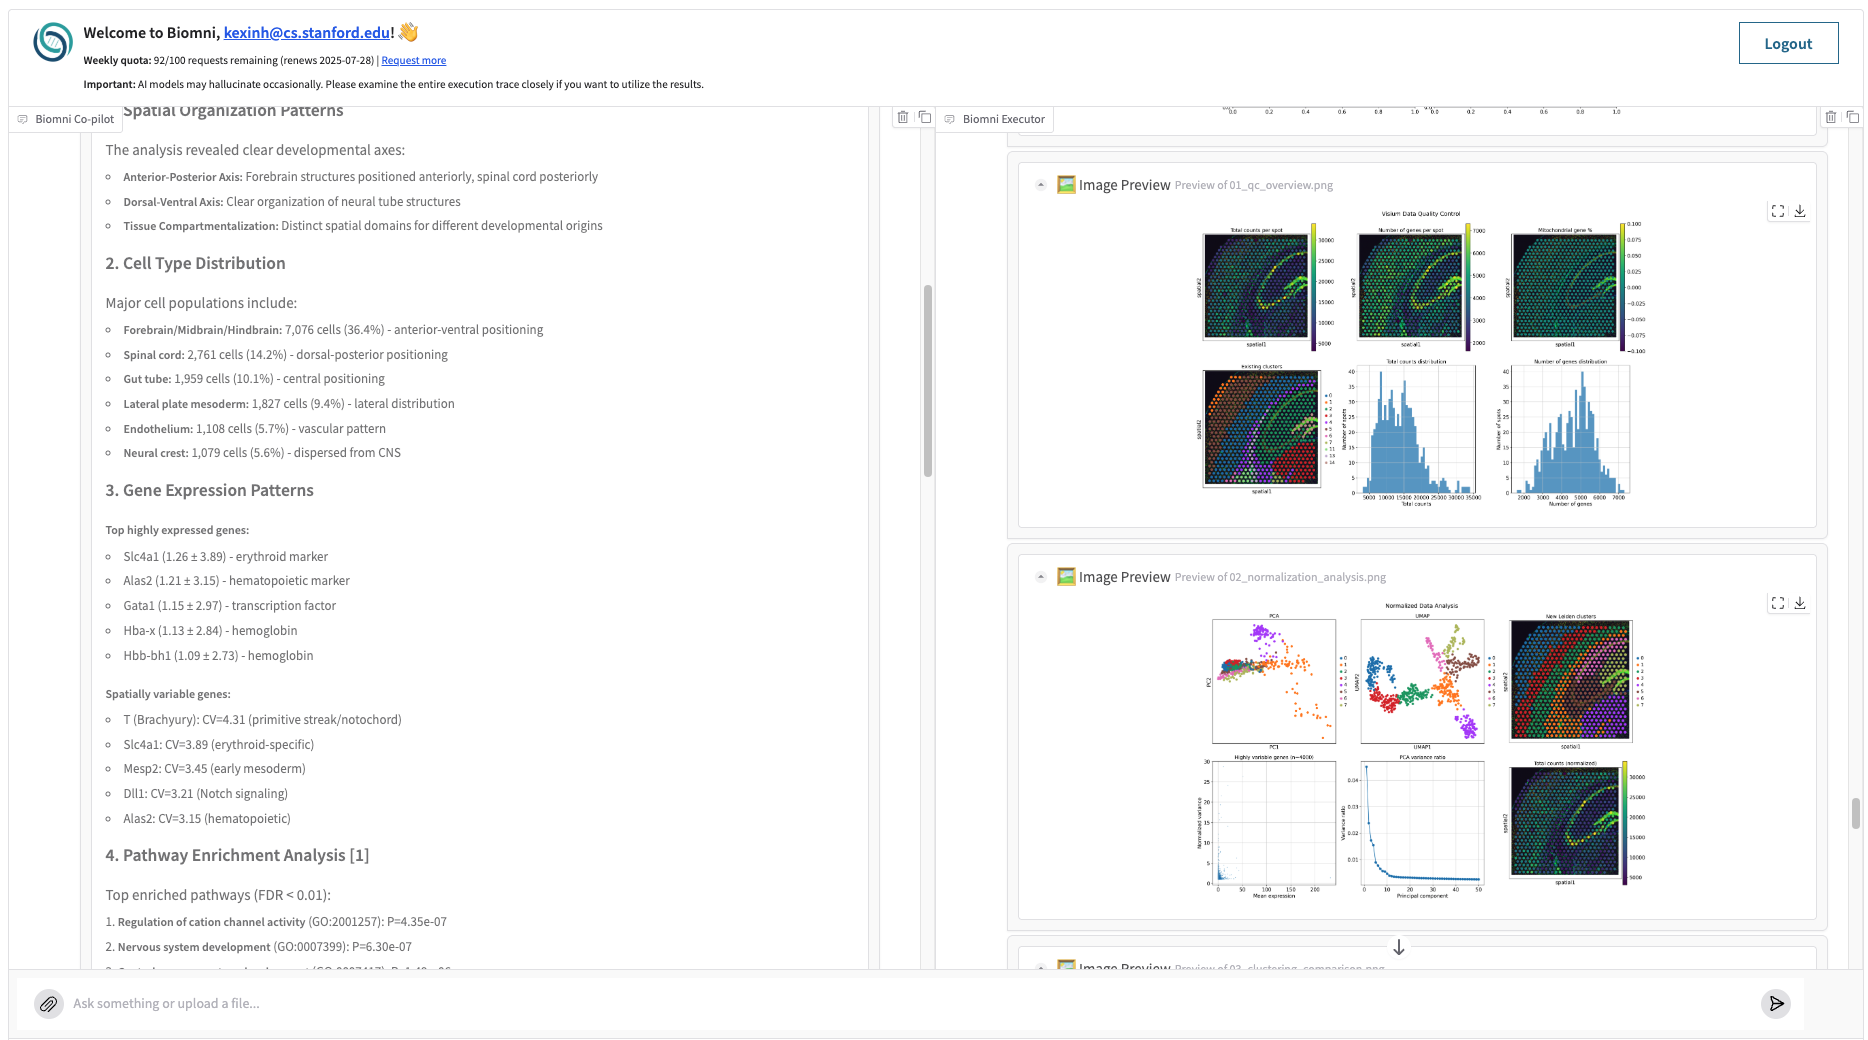
Biomni has successfully completed these steps in around 20 minutes. It preprocesses the data, identifies 21 distinct cell types from 17,771 high-quality cells, and maps them across spatial axes with clear anterior-posterior and dorsal-ventral organization. It uncovers major tissue compartments, quantifies gene expression variability (e.g., Slc4a1, T, Mesp2), and performs pathway enrichment, highlighting nervous system and cation channel activity. Biomni also infers cell-cell interactions, such as cardiomyocyte clustering and endothelial co-localization with hematopoietic progenitors. This entire sequence is automatically orchestrated by the agent, enabling reproducible and modular single-cell workflows without writing a single line of code.
Explore Single-cell Data to Generate New Hypotheses
Biomni also supports curiosity-driven no-code exploratory and hypothesis-driven analyses. By interacting with datasets through natural language prompts, researchers can easily identify biological patterns and generate meaningful hypotheses for experimental validation.
Input:
A spatial transcriptomics dataset in .h5ad format generated from seqFISH, with immune-related gene expression.
Prompt:
“Given the attached seqFISH data, explore it freely—analyze spatial and transcriptional patterns, identify interesting structures or cell populations, and generate hypotheses worth experimental follow-up.”
What Biomni does:
- [✓] Load and examine the seqFISH data structure
- [✓] Explore basic data characteristics (genes, cells, spatial coordinates)
- [✓] Visualize spatial distribution of cells
- [✓] Perform quality control and filtering
- [✓] Identify cell clusters and types
- [✓] Analyze spatial organization patterns
- [✓] Identify spatially variable genes
- [✓] Generate hypotheses for experimental follow-up
- [✓] Create comprehensive visualizations and summary
Hypothesis generated by Biomni:
| Hypothesis | Observation | Proposed Experiment | Expected Outcome |
|---|---|---|---|
| Cardiac Development | Cardiomyocytes show tight spatial clustering with high expression of Ttn, Hcn4 | Single-cell RNA-seq time course to track cardiac differentiation | Identify cardiac progenitor trajectories and developmental timing |
| Neural Crest Migration | Neural crest cells show dispersed distribution from CNS with high Sox10 expression | Live imaging of neural crest cell migration | Map migration routes and timing in real-time |
| Hematopoietic Niche | Endothelial cells co-localize with hematoendothelial progenitors | Lineage tracing of endothelial-hematopoietic transition | Identify hemogenic endothelium and transition timing |
| Anterior-Posterior Patterning | Clear spatial gradients in developmental gene expression | Perturbation of Wnt/FGF signaling with spatial readout | Identify morphogen sources and target regions |
| Mesoderm Compartmentalization | Multiple mesoderm subtypes show distinct spatial domains | Fate mapping of early mesoderm specification | Understand mesoderm subdivision mechanisms |
By combining data-driven discovery with biological reasoning, Biomni helps researchers ask better questions—and identify novel directions for experimental validation.
VIDEO: Spatial Hypothesis Generation
Access scverse tools through Biomni
Biomni Web Platform
Issue natural-language commands in biomni.stanford.edu to load files, run workflows, and inspect results interactively—no code or infrastructure setup needed.
Biomni Open-Source Integration
Clone the Biomni GitHub repository, add the new scverse dependencies, and run analyses on your own compute. This approach gives you full control over resources and data.
Disclaimer
This integration between Biomni and scverse highlights a powerful synergy, removing coding barriers while maintaining transparency, reproducibility, and scientific rigor. Although agent-based automation enhances convenience, human expertise remains vital for biological interpretation and validation. We look forward to seeing the innovative discoveries our community achieves with this exciting collaboration.